Heat Hotspot Analysis, Mapping, and Alert System in Siddharthanagar and Nepalgunj
Donor/Partner

IFRC American Red Cross

Implementation Country

Nepal

Implementation Location

Siddharthanagar Municipality and Nepalgunj Sub-Metropolitan City

Duration

March 2024- May 2024

Thematic Area

Household

Categories

Heat hotspot analysis

Rationale

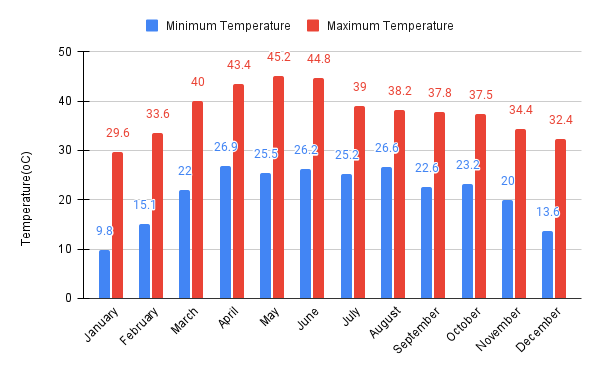
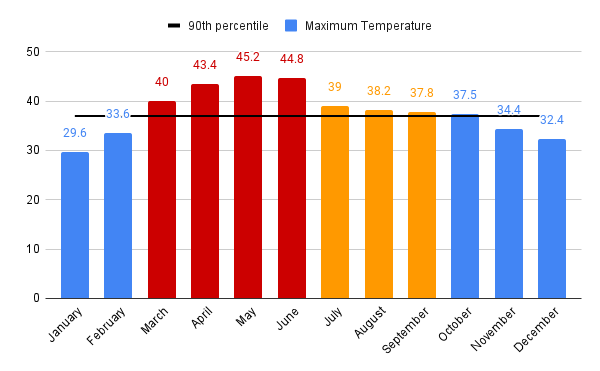
The Terai region of Nepal experiences temperatures exceeding 40°C annually, with humidity levels reaching up to 80%. Urban areas in the lowland Terai are particularly at risk during heat waves due to the urban heat island effect. Factors such as urbanization, extensive concrete structures, high population density, and the compounding effects of climate change exacerbate this situation, leading to severe health conditions, injuries, and deaths.

Hence, it is essential to identify heat hotspot areas and assess their impact. Additionally, cities should focus on creating comprehensive plans to address heat waves by implementing strategies such as warning systems, readiness measures, and sustainable solutions.

1536

Households

17

Local Enumerators Trained and Mobilized

3

KIIs conducted

1

Mapathon

4

FGDs conducted

Objectives

To strengthen local response and preparedness for heat waves by equipping communities with the knowledge and tools needed to effectively reduce the impacts of heat waves.

Sub Objectives

1

Strengthen local government frameworks.

2

Increase the capacity of vulnerable populations.

3

Establish long-term resilience against heat waves in the Terai region.

Major Activities & Deliverables/Outputs

Activities

Deliverables/Outputs

Collect and analyze satellite images, weather data, and other relevant information.

Household survey for 1500+ households.

Map buildings, roads, and open spaces to identify risk areas.

Train and mobilize local Red Cross Volunteers in digital data collection.

Digitization of Building footprint, road networks, crtical infrastrucutres, land use.

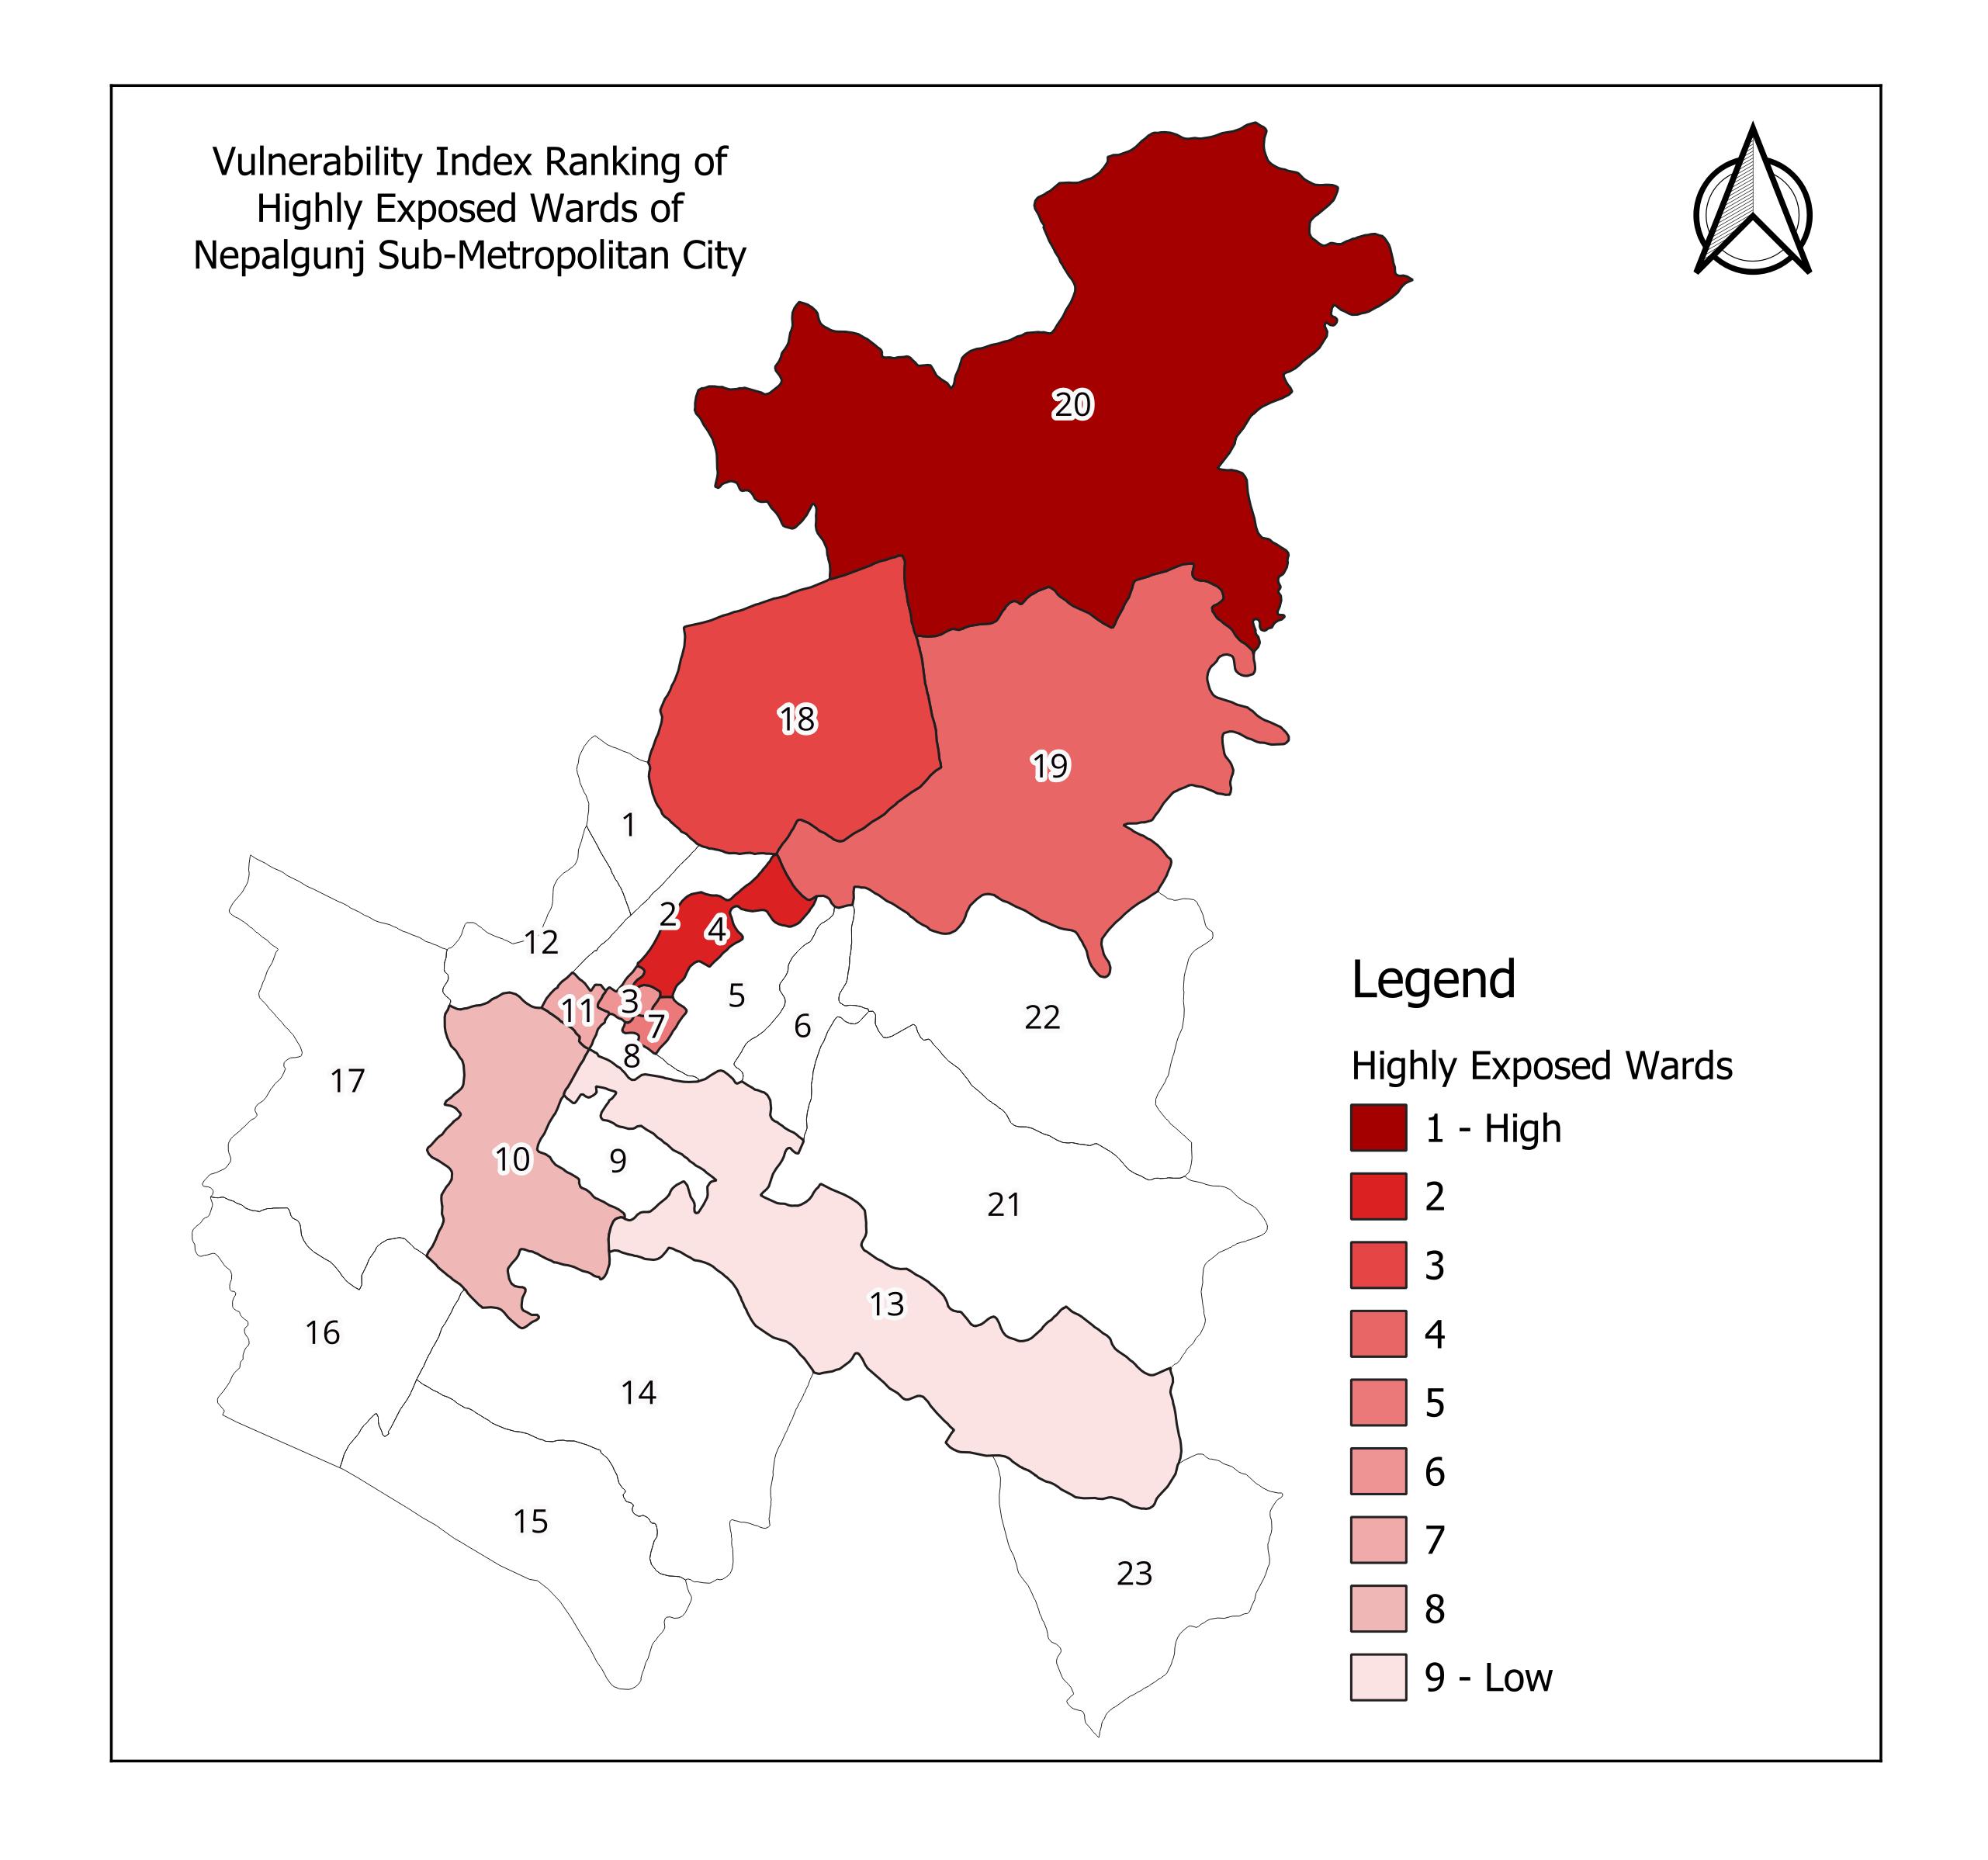
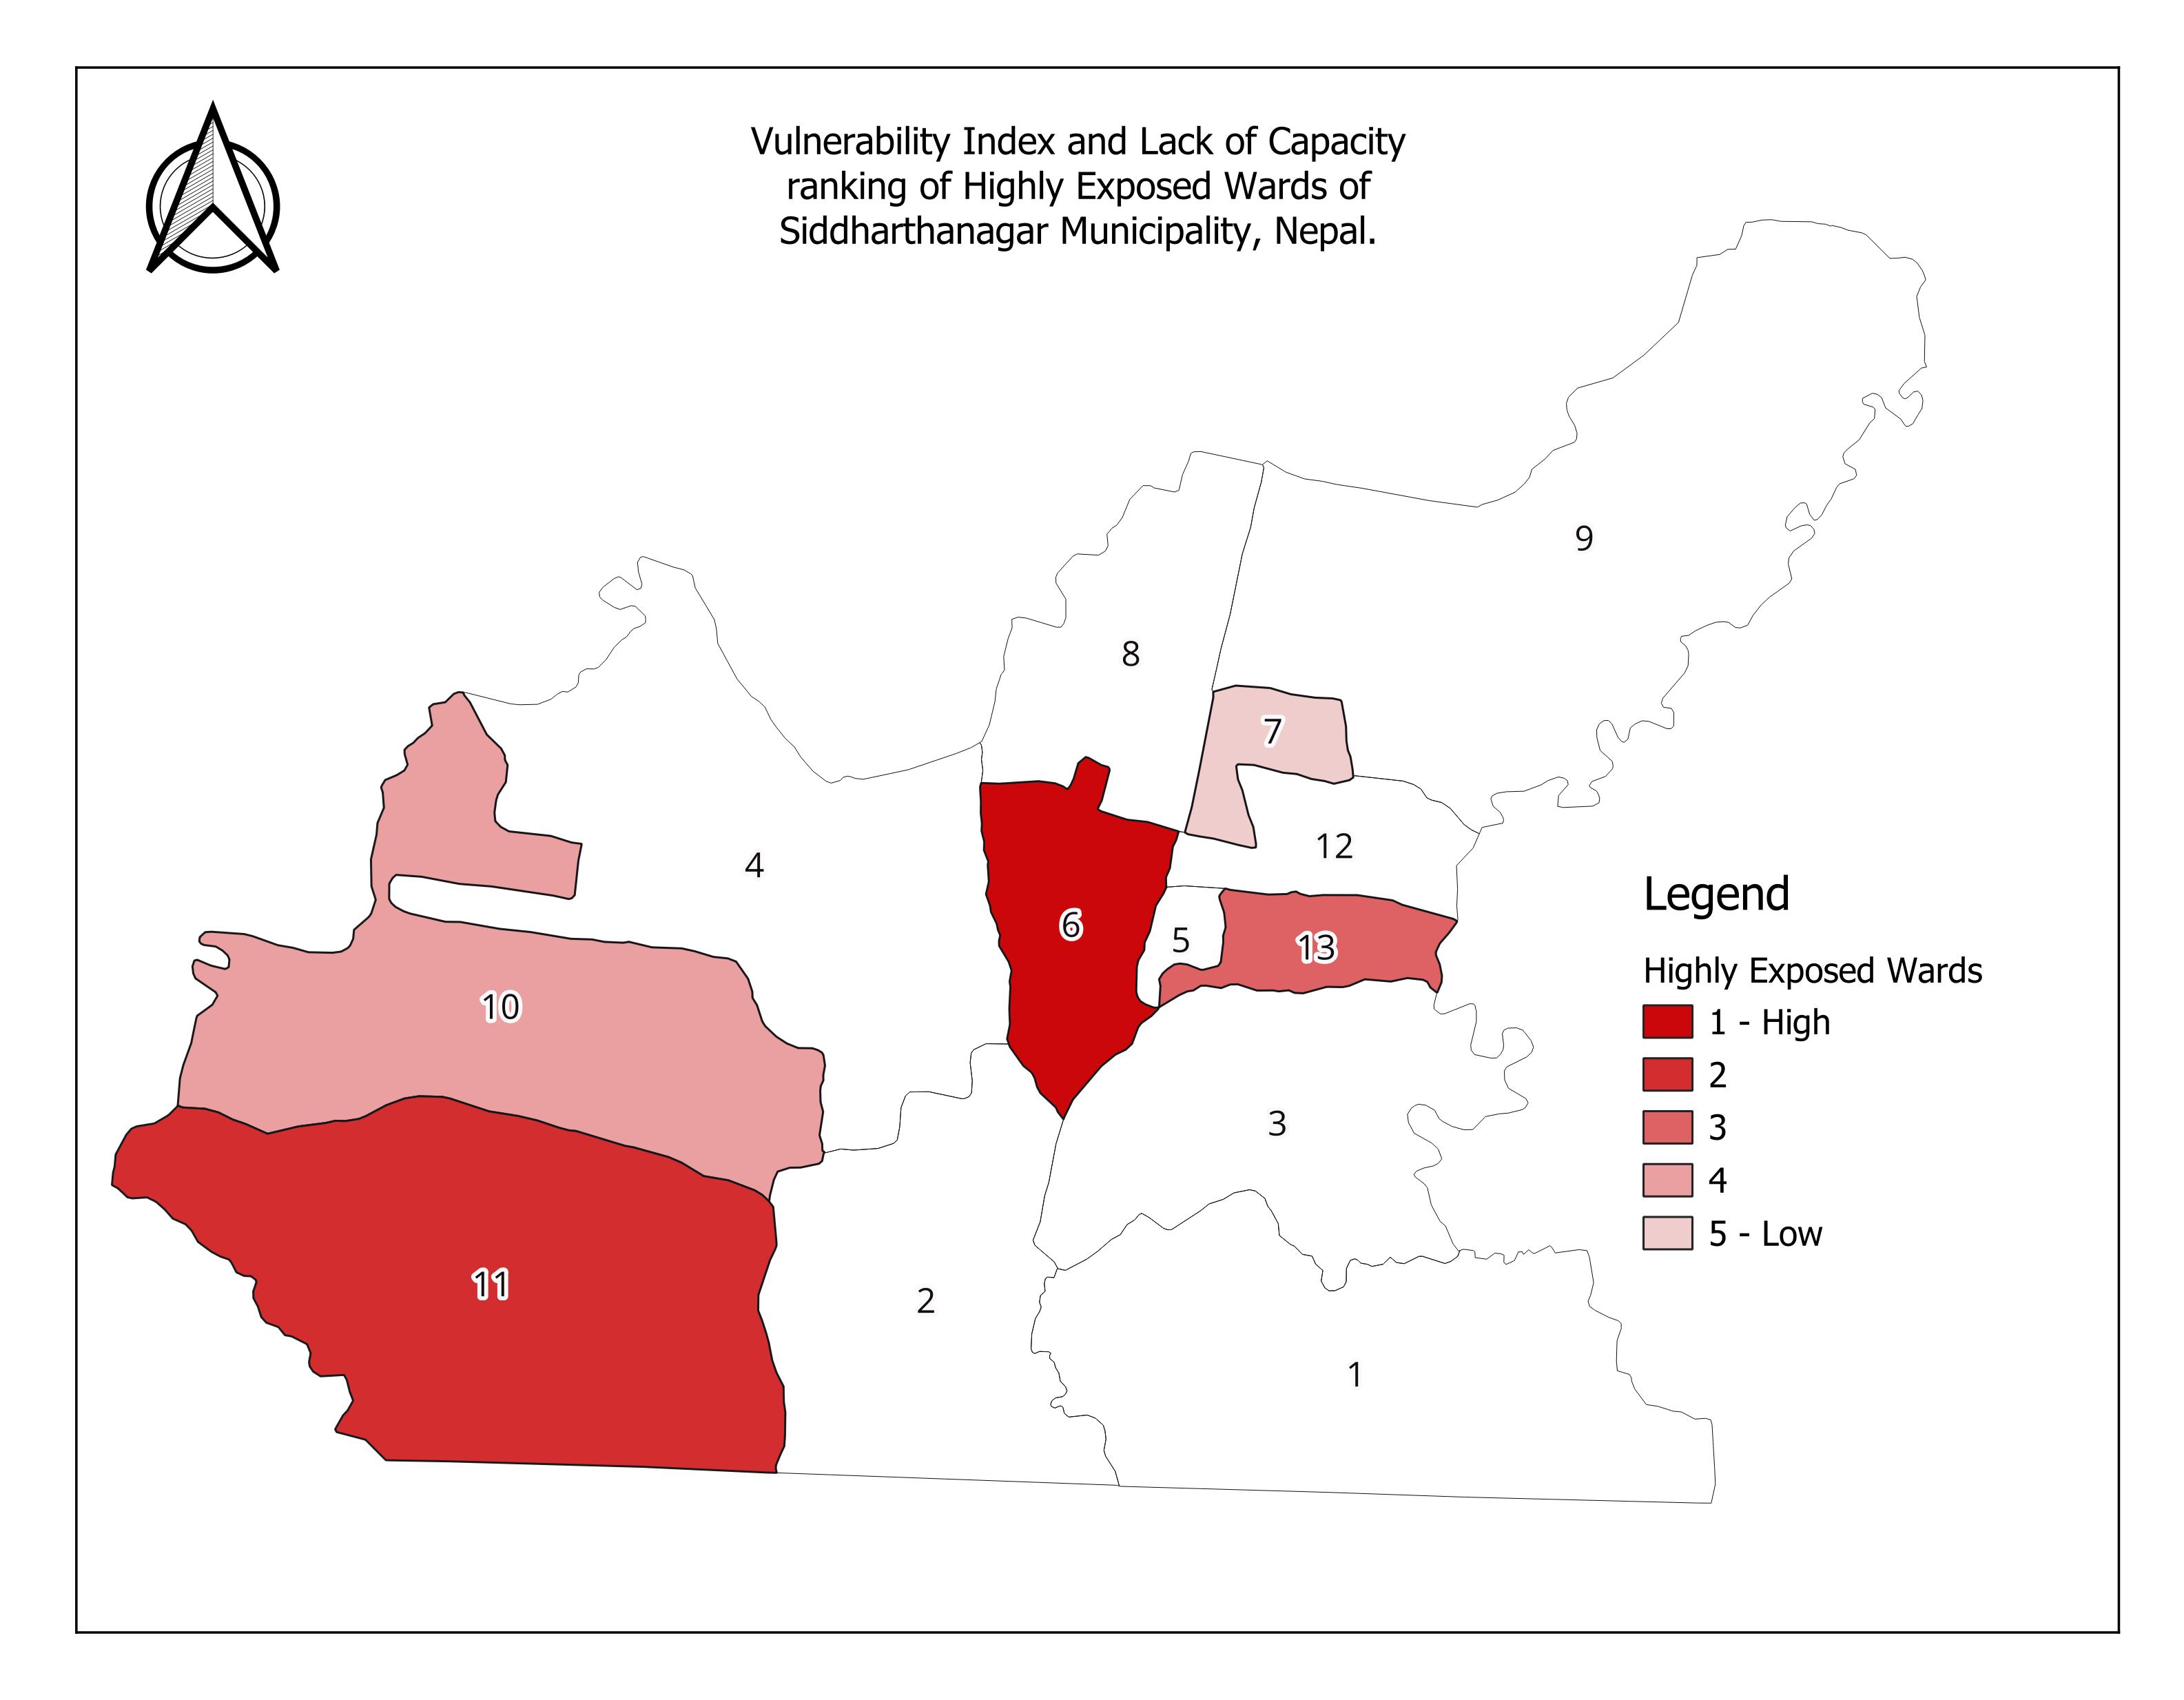
Ward-level Heat hotspot Analysis using Census data and local government records.

Perform exposure, vulnerability, and capacity analysis.

Household-level Heat hotspot Analysis using Field Survey data in NAXA Assessment.

Web-Based Interactive Visualization and Alert System.

Create an online platform to monitor heat levels in real-time.

Outcomes

1

Empowered Policy Formulation

Local governments are well-equipped to formulate informed plans, policies, and frameworks based on the analysis results, leading to more effective management and mitigation of heatwave impacts.

2

Enhanced Heatwave Management

Aid the stakeholders in effective identification, monitoring, and management of heat hotspots using real-time meteorological data and early warning systems.

Gallery